
Stadler rail

PWA and SasS system for the rail industry
Data Visualisation, Design, Mobile app, Web Development, Web application/SaaS

Stadler rail needed an easy to use system for keeping track of the running condition, defects and cleanliness of their rolling stock.
Using my OnSight reporting system as a base, I developed a bespoke PWA and SaaS system that allows the client to keep track of all their rolling stock in one digital place. This gives the employees a very user-friendly way to input data as they repair and clean the rolling stock. It gives management a clear overview, along with graphed KPIs and historical tabled data, of the state of each carriage. The system also gives some BI perception of where potential bottlenecks occur over single carriages and the whole stock.
The system is fully responsive and works on all devices, including iOS and Android for the front end reporting and any higher resolution displays for the admin backend. The system has been running for over 3 years now without any hick-ups or complaints and we are excited to further develop it's remit in the future.
View project
Core systems

Bespoke SaaS system: complete digital project management for the civil engeering sector
Data Visualisation, Design, Web Development, Web application/SaaS

Core systems was developed from a very exact client brief that had everything they needed to digitally run national civil engineering contracts without a hitch …well, more importantly, with a system that can handle the unknown hiccups that would inevitably crop up on such large projects.
I designed the front end to be clean, simple and most of all: user-friendly. My user experience design always puts the users first; this is a working tool and not a pretty marketing campaign. I built the front-end in a mixture of HTML5 and javascript for realtime interaction with the API backend, built by an off-shore company.
The system is very comprehensive, covering the whole scope from start to finish of the contract. From client database, proposal, baseline timetable and costs forecasts and digital contracts before the work started. Once the on-site work was underway the system tracked every aspect of the job digitally, it is important to have a perfect trail of documents for this type of work for transparency and audit reasons, as the end clients are often public or govt. bodies but also when managing projects with budgets into the millions, you need to be able to see where the cost has gone. Included were a daily work diary to log all workers’ hours on-site, a ‘change request’ system with various automatically generated impact assessments and dynamic graphs and tables clearly showing costs and time efforts.
The system has a real-time summary overview and can generate more in-depth weekly progress reports, giving the managers an invaluable oversight week on week, to help them spot and solve problems before they become large issues. The system also has to handle the raising of invoices and tracking of payment against each change request and timetabled payment, this was logged per instance but also I generated the culmative data into tables and graphs for user ease - designing a user-friendly system is about putting the correct information in front of the user just as much as it is making sure they can navigate the system with ease.
View project
Quest

Intuitive UI driven learning tool
Animation, Data Visualisation, Design, Web application/SaaS
 BAFTA Interactive Award
EMMA Foundation Award
BETT Award Learning beyond classroom
BAFTA Interactive Award
EMMA Foundation Award
BETT Award Learning beyond classroom > view video walkthrough

From my original interface concept UI design, I produced an exciting learning tool for 11-14 year olds to learn about the UK and it's places of interest they can visit. The spinning menu and zooming map are an exciting way into the roughly 2000 pieces of database driven content. This flagship application of gridClub.com helped the site walk away with a BAFTA, a BETT and an Emma Foundation award.
View project
View project
Medical simulation single page web app

Responsive HTML5 medical case study
Data Visualisation, Web Development, Web application/SaaS

SEI Healthcare needed their specialist patient simulation project updating with a new look and content. Doctors go to the site and test their knowledge in specific disease areas through multi-patient quizzes, based on a multiple choice format. Hopefully the physicians learn a little along the way thanks to the heavy emphasis on feedback to answers, references and peer stat review charts.
A major requirement was also that it worked fluidly on mobiles, tablets and desktops (see second half of video walkthrough for the mobile site). The site needed to be a modern single page app that interacted with the API seamlessly.
From the client's designs I built the HTML front end using bootstrap, jQuery and javascript, along with a little php to write my own missing parts of the API. The site is live and public facing but requires a log in, which you can get for free but only if you have medical credentials (most of my work in this sector is top-secret and cannot be shown, so it is refreshing to be able to have this piece in my portfolio!).
View project
Interactive multi-touch attractor toys

Interactive toys to show off the client's large format 84" touch screens
Animation, Data Visualisation, Design, Offline/Installation
> watch video of 'nodes'
> watch video of 'flock'

The client came to me to concept, design and build several interactive 'attractor' apps for their latest line of very large multi-touch TVs. These TVs are located in hotel lobbies, trade shows, clubs etc. They play one of the attractor apps in demo mode until a passer-by's interest is piqued and they investigate and play with attractor.
Each interactive had to interesting enough in demo mode but also highly 'touchable' and playful when a user (or multiple users) came to play. The high-end TVs have an nice Android system on-board to run these interactives.
View project
Each interactive had to interesting enough in demo mode but also highly 'touchable' and playful when a user (or multiple users) came to play. The high-end TVs have an nice Android system on-board to run these interactives.
View project
Train departure board screens
Mission critical live-data display boards
Data Visualisation
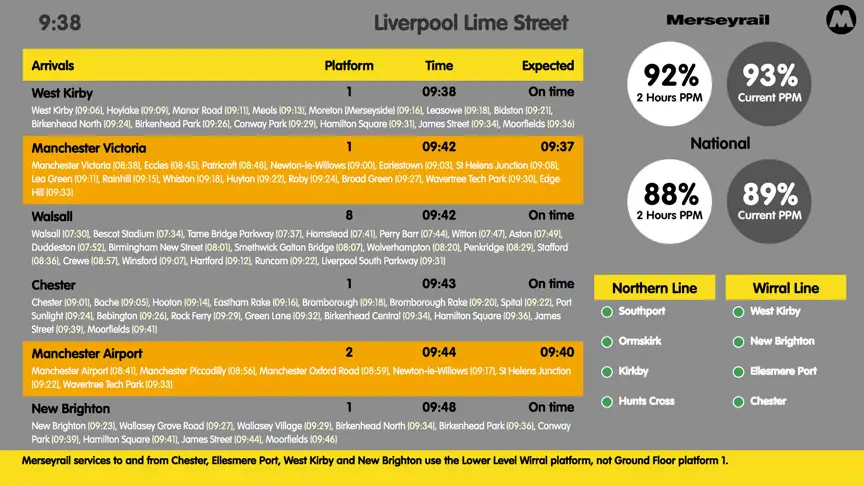
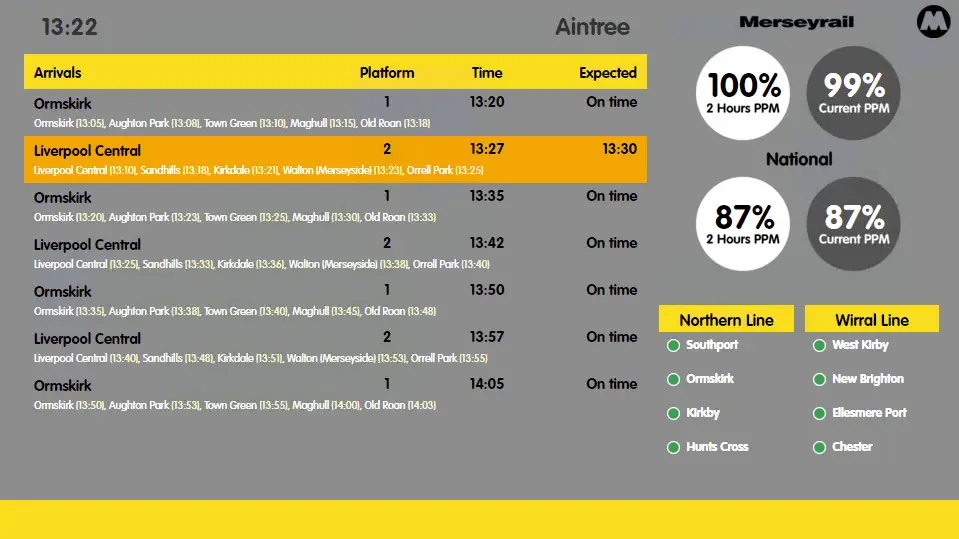
Merseyrail wanted to clearly display 3 groups of information all on the same screen. I started from scratch designing the UI to be to be both easy to scan and easy to drill-down into the live data. The boards/screens show:
• Arrivals and deptartures for the assigned station
• Merseyrail's real-time 'trains on time' status and the rolong average from the last 2 hours, along with the national average of these for comparison.
• The current state of both lines and the four major stations along those lines.
HTML/ajax/php talking to National Rail's DARWIN live train web-service, Merseyrail's own PPM and line status feeds.
View project
Roster shift system

UI and database design
Data Visualisation, Design, Web application/SaaS

I designed and built a roster system for Merseyrail that handles their very complicated shift patterns and rota systems for all their stations and support workers. Admin users can easily add new rotas, build shift patterns, add new people to shifts from the LDAP employee lookup system and generate shift sheets for any future week.
Designed with the user at the forefront of the UI and built using HTML, javaScript, php and mySQL.
View project
Designed with the user at the forefront of the UI and built using HTML, javaScript, php and mySQL.
View project
Staff engagement touchscreens
Networked attached Touchscreen for Merseyrail
Data Visualisation, Design, Web application/SaaS
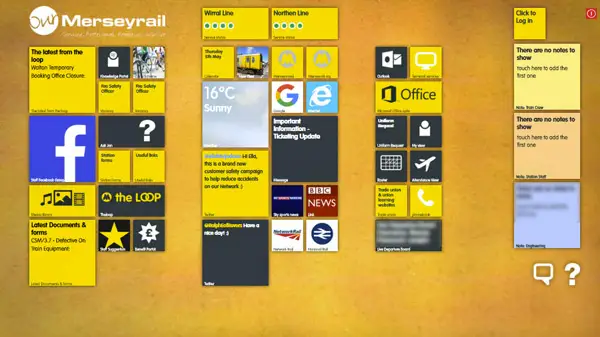
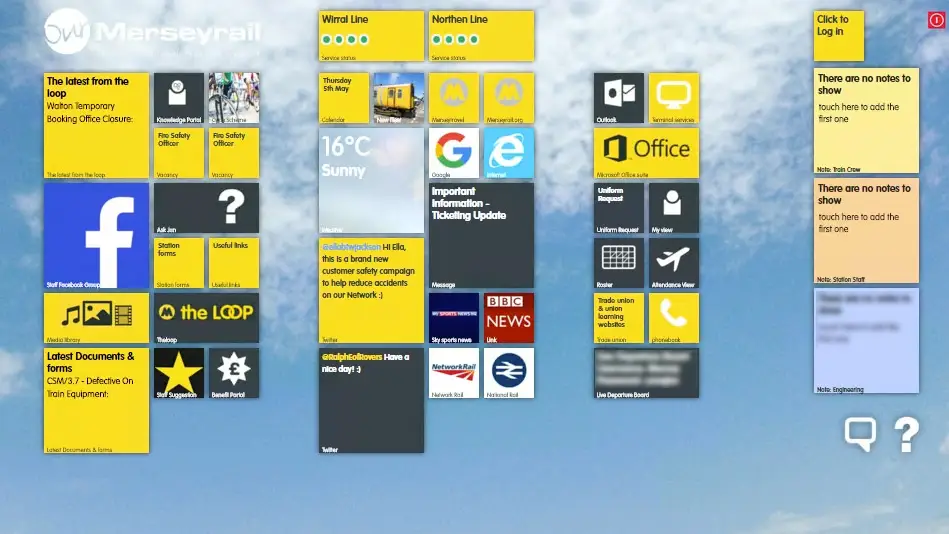
Merseyrail had a lot of staff missing out on access to their intranet because they were not in the same place long enough to log onto their desktop machines. The solution was a set of 90+ touchscreens dotted around station break rooms and driver rest stops, that had all the best from the intranet and was a gateway to more in-depth info.
The screens show lots of 'quick bite' snippets of dynamic information; the current weather direct from the MET office, line running status, latest news etc. But also have meatier servings like an LDAP powered employee lookup, 'post-it' note message system for staff comms, latest Merseyrail news stories, job vacancies, commonly needed forms along with the usual high-frequency external links of Google, Network Rail, BBC news etc.
The frontend UI is built using HTML, CSS & javaScript with a PHP & mySQL backend. Fun-fact: I took a photo for each of the possible weather conditions for the weather 'tile', but it was hard to test properly as it only ever rains in Liverpool ;)
View project
Information Design

info viz and organic information design
Data Visualisation, Design, Offline/Installation

I love the challenge of visualising massive data sets in an organic and user friendly way. Whether it be a small graphic to show loads of weather information in a single glance or creating dynamic environments that evolve as you navigate a massive database to find that useful set of data out of the 70,000+ items.
View project
View project
Computational Design

personal work
Data Visualisation, Design, Offline/Installation

Whenever I get a spare moment I try and make a small program that helps explore an area of computational design. This is design (or art) that is created through the use of interactive/iterated algorithms. These vary from experimental interfaces to 10 minute toys. ...mostly just used to generate nice posters ;)
View project
View project
Selfridges London - In-store promotional installation

Will.i.am+ foto-sosho iPhone camera for will.i.am/Selfridges
Animation, Data Visualisation, Design, Digital Advertising, Offline/Installation
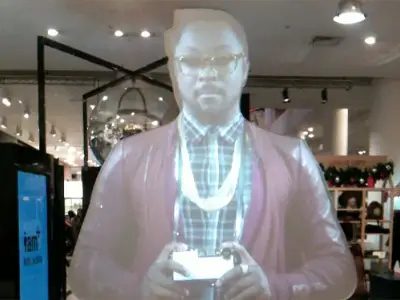
I like being a freelance designer and developer as I get to work with lots of nice people, once again with the smart people at Tangent90 I built a local installation that played out over a few plasma screens in the entrance of Selfridges London. The installation took pictures of everyone coming through the door, which then where cropped to a head and shoulders image, which then found themselves 'dropping' into my mosaic of other customer's faces. The mosaic tiles are then colour tinted and make up a larger image of Mr I.am.
Depending which version is running at the time, we either play a promo video every few minutes or (my personal favourite) explode the mosaic's tiles and spin them around in 3D before putting them back in their correct places. For no reason beyond eye candy but, for once, that is what you need to attract the passers-by attention.
View project
User generated image and video viewer

Imagination challenge for Adobe
Animation, Data Visualisation, Web Development

Working with the guys at yomego Scotland, I built a nice little user generated content viewer. All the user's competition entries can be filtered by location and then the app selects a random selection of entries from that location to display. Some are videos, some are images, some portrait and some landscape - the app handles them all.
Thanks to yomego's Facebook API, we also were able to use the app to view the user's Facebook photos.
The client needed to place the project on different sites at different sizes so it is nice and scalable to fit any size that gets thrown at it :)
View project
Thanks to yomego's Facebook API, we also were able to use the app to view the user's Facebook photos.
The client needed to place the project on different sites at different sizes so it is nice and scalable to fit any size that gets thrown at it :)
View project
BBC Interactive TV

Information Design + user testing
Animation, Data Visualisation, Design, Offline/Installation

At the BBC's interactive TV design department, I designed and built interfaces and models for current and future interactive TV services as part of the 'Future Interface group'.
This ranges from simple 'now and next' type screen overlays to imagining future interfaces for the next gen. of digital personal recorders which need to allow browsing and searching of 70,000 data items.
View project
This ranges from simple 'now and next' type screen overlays to imagining future interfaces for the next gen. of digital personal recorders which need to allow browsing and searching of 70,000 data items.
View project